

It is widely accepted that widespread adoption of renewable energy sources such as solar and wind into the electric grid will be key to meeting carbon reduction targets and achieving global clean growth ambitions. In a previous blog post, we saw how OrxaGrid’s Low Carbon App enables building owners to quickly and accurately calculate the optimal size of Solar PV installations.
In this blog, we will dive deeper to understand how to read the Solar PV output file.

Output
Once the inputs are submitted, the algorithm quickly estimates the ideal size of solar PV installation that would be appropriate for installation. Furthermore, the app will also provide insights on expected revenue from the installation and payback period. A sample result is shown below:
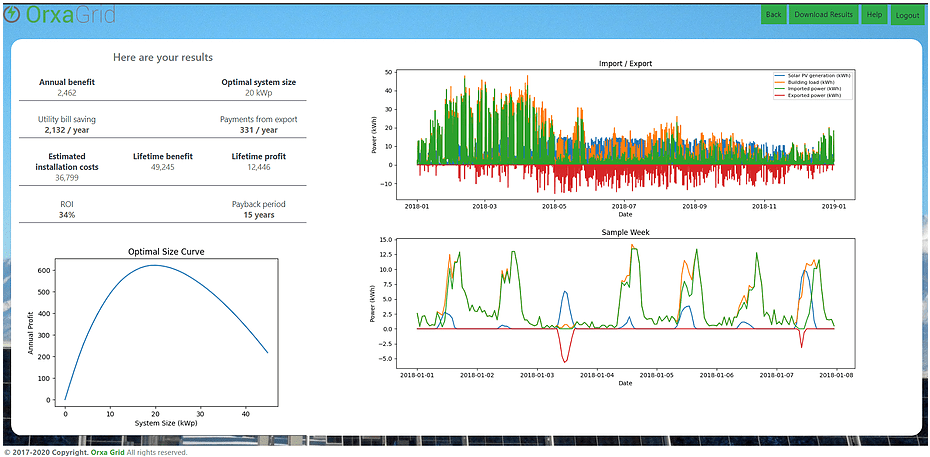
Output results show the ideal system size and the expected financial benefits to installation:
- Annual Benefit: displays the aggregate annual savings and aggregate revenue earned by exporting electricity to the DISCOM
- Optimal System Size: solar system rating (in Kilowatt peak (kWp)) required in order to maximize financial benefits. The kWp of a system takes into consideration the inputs you provide such as how much area is available to accommodate the panels, how much a typical installation costs (Cost per kWp) in your area and how much energy you consume at your location
- Utility Bill Saving: yearly savings as a result of paying less in utility bills. The model akes into account your utility tariff rates and the amount of energy your solar installation would produce throughout the year
- Payments from Export: projected earning from exporting unused electricity to the electricity grid, provided that regulations allow for net metering and export of electricity
- Estimated Installation Costs: projected installation costs for installing the solar system of the recommended optimal size. This is a multiplication of your optimal system size as recommended by our model and the System Cost per KWh that you entered in the input form
- Lifetime Benefit: projected total financial benefit over the expected life of the system, not adjusted for inflation. The expected life is assumed to be 20 years
- Lifetime Profit: projected lifetime profit from solar installation
- Return On Investment (ROI): projected return on investment. A high ROI means the solar installation’s gains will compare favorably to its cost. ROI can be used to evaluate the efficiency of your investment or to compare the efficiencies of several different investments
- Payback Period: The time in years required to recoup (or reach the break-even point) the estimated installation costs if solar system of recommended size was to be installed
- Optimal Size Curve: A chart to show how annual profit will vary depending on the size of the system.
- Import/Export: A visualization to describe pattern of energy use through the year
- Sample Week: displays energy consumed, generated, imported and exported energy in kWh
In this manner, OrxaGrid’s Low Carbon App empowers prospective users of solar installations with required information to made judicious, data-driven decisions.
This blog is summarized from OrxaGrid’s publication. To learn more about how OrxaGrid is enabling a sustainable energy future, please visit www.orxagrid.com or e-mail us at marketing@scopetnm.com .
